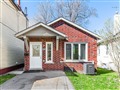
78 Byng Ave
$1,475,137
Comparative Market Analysis
Apr 25, 2024
NOT AN ACTIVE LISTING
Historical Performance
| Period | $ Change | % Change |
| 1 Day | +$374 | +0.025% |
| 7 Days | +$1,691 | +0.115% |
| 30 Days | +$5,164 | +0.351% |
| 3 Months | +$25.0k | +1.72% |
| 6 Months | +$95.5k | +6.92% |
| 1 Year | +$128k | +9.54% |
| 3 Years | +$539k | +57.6% |
| 5 Years | +$669k | +83.0% |
| 10 Years | +$994k | +206% |
List My Property
Real Estate Statistics
Financing Solutions
AS SEEN ON

Are You a Licensed Real Estate Agent or Broker?