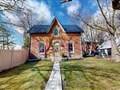
59 Halfmoon Sq
$1,418,118
Comparative Market Analysis
Apr 25, 2024
NOT AN ACTIVE LISTING
Historical Performance
| Period | $ Change | % Change |
| 1 Day | +$327 | +0.023% |
| 7 Days | -$103 | -0.007% |
| 30 Days | -$3,554 | -0.250% |
| 3 Months | -$6,333 | -0.445% |
| 6 Months | +$19.9k | +1.42% |
| 1 Year | -$75.3k | -5.04% |
| 3 Years | +$233k | +19.7% |
| 5 Years | +$402k | +39.6% |
| 10 Years | +$904k | +176% |
List My Property
Real Estate Statistics
Financing Solutions
AS SEEN ON


Are You a Licensed Real Estate Agent or Broker?