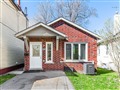
57 Byng Ave
$1,411,255
Comparative Market Analysis
Apr 24, 2024
NOT AN ACTIVE LISTING
Historical Performance
| Period | $ Change | % Change |
| 1 Day | +$358 | +0.025% |
| 7 Days | +$817 | +0.058% |
| 30 Days | +$711 | +0.050% |
| 3 Months | +$7,474 | +0.532% |
| 6 Months | +$49.4k | +3.63% |
| 1 Year | +$935 | +0.066% |
| 3 Years | +$427k | +43.4% |
| 5 Years | +$658k | +87.4% |
| 10 Years | +$934k | +196% |
List My Property
Real Estate Statistics
Financing Solutions
AS SEEN ON

Are You a Licensed Real Estate Agent or Broker?